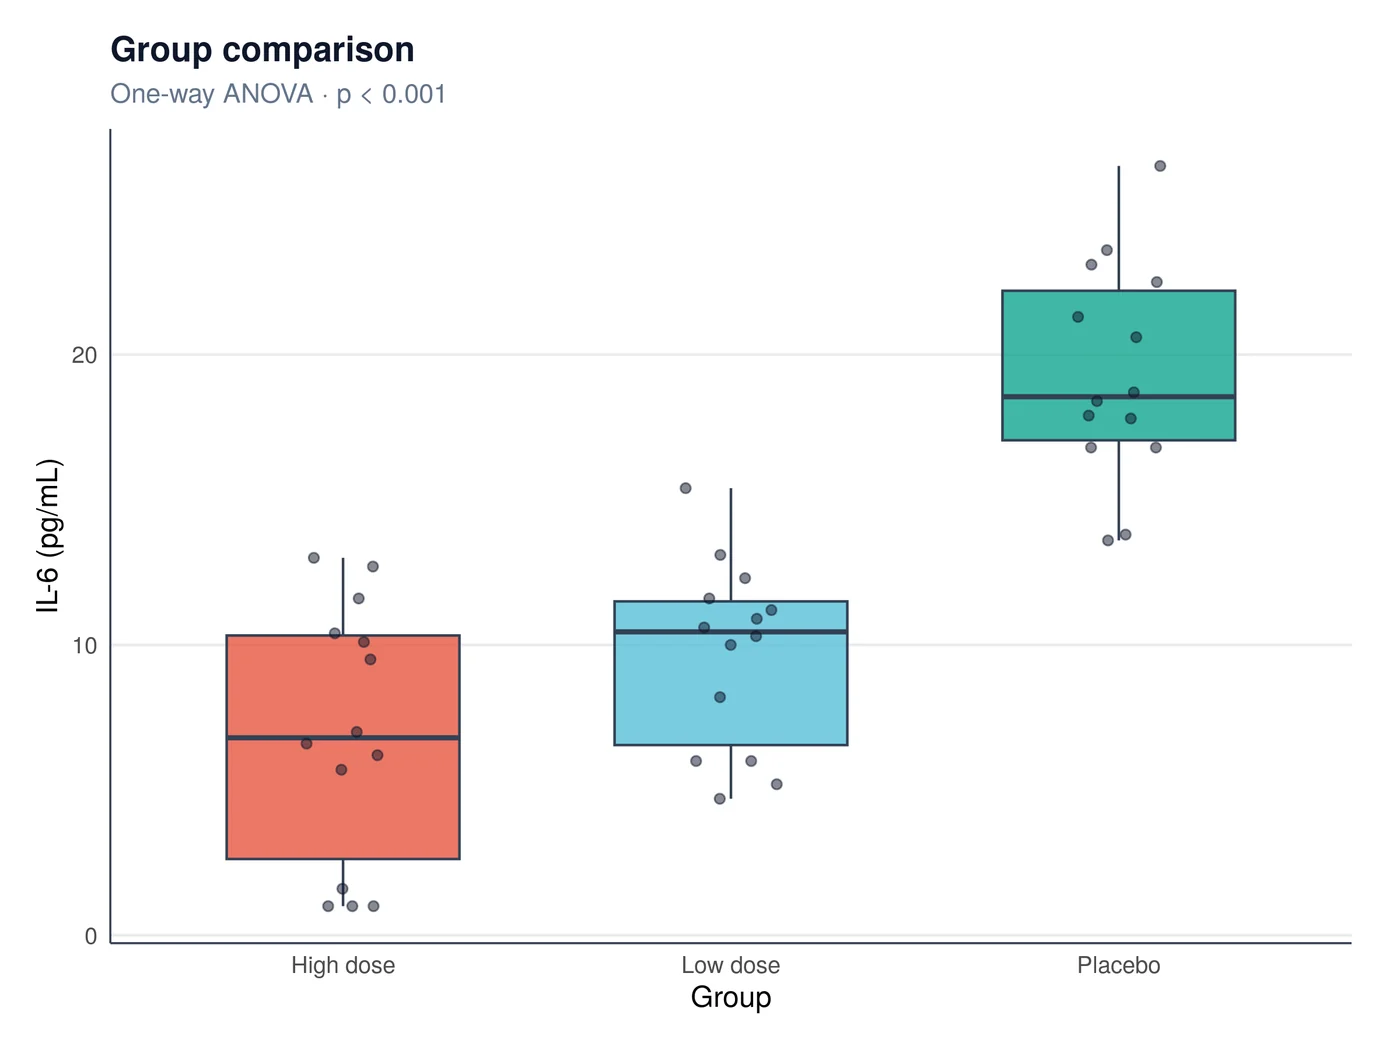
Boxplot with the right test, picked by a fixed rule
Paste a group column and a numeric column. PlotScope checks normality in each group and the equality of variances, then runs the matching test in R, with the effect size and the post hoc comparisons.
Your table
| group | il6 |
|---|---|
| Placebo | 18.4 |
| Low dose | 11.2 |
| High dose | 7.9 |
One row per subject: a group column and a numeric column.
How it is chosen
Shapiro-Wilk in each group, then Bartlett for equal variances: normal → Welch's t (2 groups) or ANOVA / Welch ANOVA (3+); not normal → Mann-Whitney or Kruskal-Wallis with pairwise Wilcoxon (Benjamini-Hochberg). The rule runs before anyone sees the p-value.
You get
- Box, violin or dot plot with the test
- Effect size (Hedges' g or η²) and post hoc table (Tukey or Games-Howell)
- APA table, methods paragraph, R script and software to cite
R packages: R · stats · ggplot2
Questions
Why not let me pick the test?
So the choice cannot depend on the result. The rule looks at normality and variances first and writes down why it chose the test.
Can I ask for a specific test anyway?
Yes, ask in the chat; the reason for the default is still shown so you can report it.