Statistics in real R
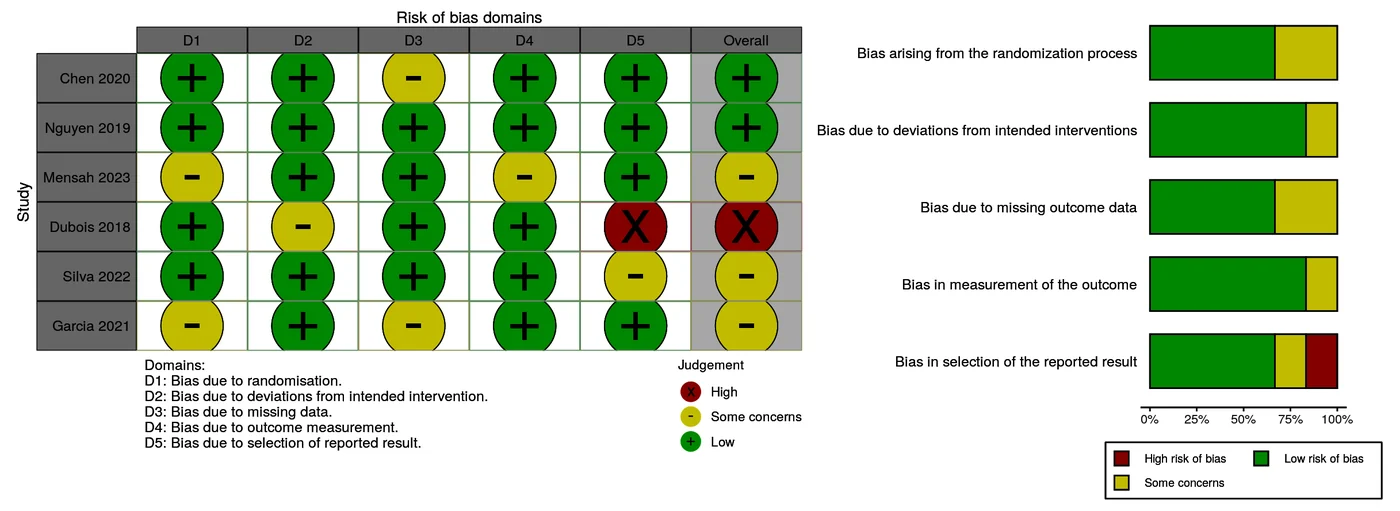
Risk of bias figure (RoB 2 traffic light), made in R
Type your RoB 2 judgements per study and domain and get the traffic-light plot and the summary bars from robvis, ready for the paper. ROBINS-I judgements work too.
Your table
| study | D1 | D2 | D3 | D4 | D5 | overall |
|---|---|---|---|---|---|---|
| Chen 2020 | low | low | some | low | low | low |
| Dubois 2018 | low | some | low | low | high | high |
One row per study with your judgement for each domain: low, some concerns or high (ROBINS-I: low, moderate, serious, critical).
How it is chosen
The judgements are yours; PlotScope draws them with robvis and never invents a rating.
You get
- Traffic-light plot and summary bars in one figure
- PNG, TIFF, SVG and PPTX
- Software to cite: robvis with its reference
R packages: R · robvis · ggplot2
Questions
Does PlotScope judge the risk of bias for me?
No. You give the RoB 2 judgements; PlotScope turns them into the standard figure.
Which tools are supported?
RoB 2 for randomised trials and ROBINS-I for non-randomised studies.