Network meta-analysis online, run in R
Compare three or more treatments with direct and indirect evidence. One table of study contrasts gives four publication panels from the R package netmeta: the network graph, the forest plot against a reference, the league table and the SUCRA ranking.
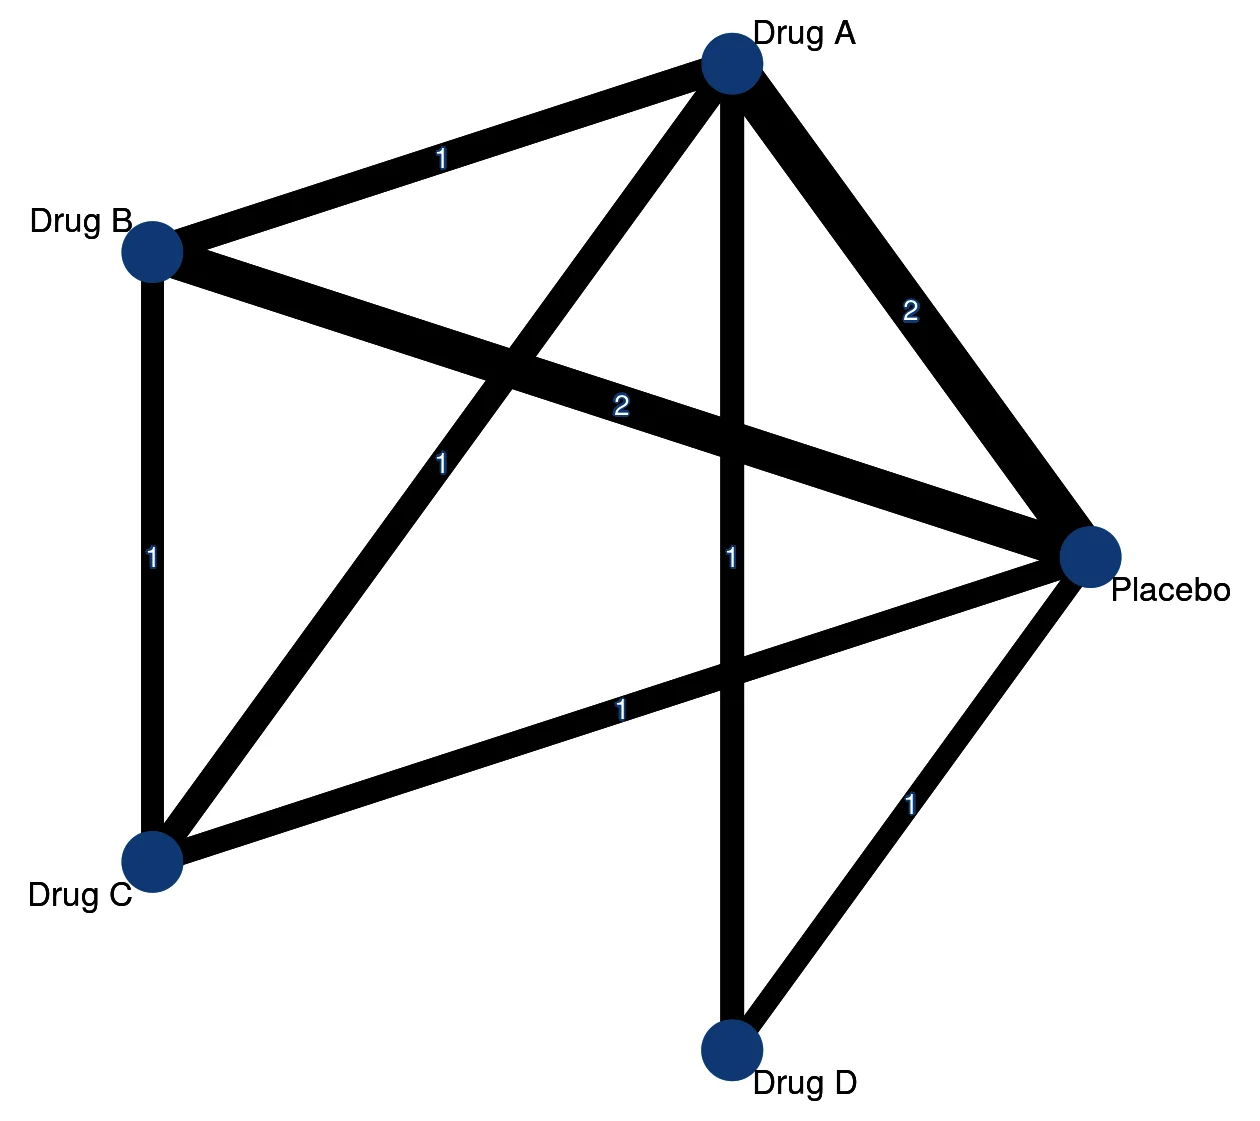
Your table
| study | treat1 | treat2 | TE | seTE |
|---|---|---|---|---|
| S1 | Placebo | Drug A | -1.2 | 0.30 |
| S3 | Placebo | Drug B | -1.6 | 0.32 |
| S6 | Drug A | Drug B | -0.4 | 0.33 |
One row per study contrast: the two treatments, the effect and its standard error. For ratio measures (OR, RR, HR) the effect goes on the log scale. The network must be connected.
How it is chosen
Random-effects network meta-analysis (netmeta) with the frequentist model; the reference treatment can be chosen; ranking by SUCRA.
You get
- Network graph, network forest plot, league table and SUCRA
- Every panel in PNG, TIFF, SVG and PPTX
- Methods paragraph, R script and software to cite
R packages: R · netmeta · ggplot2
The inconsistency test, component network meta-analysis and CINeMA certainty for each comparison live in MetaScope. Open MetaScope ↗
Questions
What table does a network meta-analysis need?
One row per study contrast with the two treatments, the effect and its standard error. Ratio measures go on the log scale.
Can PlotScope test inconsistency or grade certainty with CINeMA?
Those run in MetaScope, the systematic review app from the same team; PlotScope makes the four network panels.