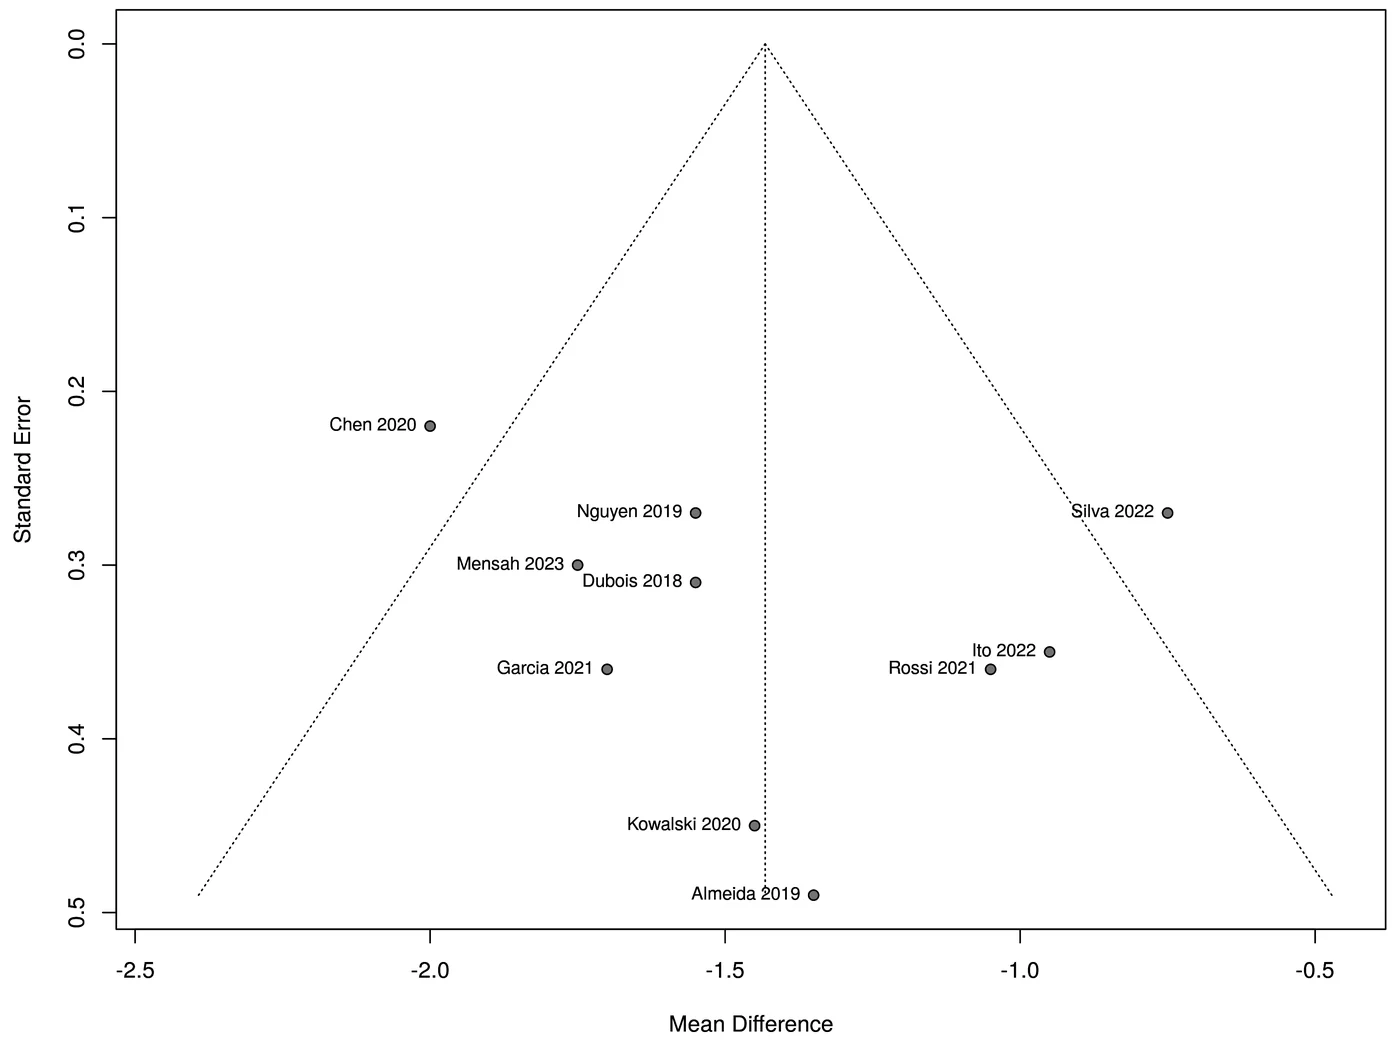
Funnel plot and Egger's test, run in real R
Check small-study effects in your meta-analysis with the funnel plot from the R package meta and the regression test for funnel asymmetry: Egger's test for continuous outcomes, and a test that is valid for binary outcomes when your data are events.
Your table
| study | TE | seTE |
|---|---|---|
| Chen 2020 | -2.00 | 0.22 |
| Nguyen 2019 | -1.55 | 0.27 |
| Silva 2022 | -0.75 | 0.27 |
The same table as the forest plot works: means per arm, events per arm, or an effect (TE) with its standard error (seTE).
How it is chosen
Funnel plot with the pooled effect and pseudo 95% limits. Asymmetry test: Egger for continuous outcomes; binary outcomes are routed to a test that is valid for them. With fewer than 10 studies the test has little power, and PlotScope says so.
You get
- Funnel plot in PNG, TIFF, SVG and PPTX
- Asymmetry test with its p-value
- Leave-one-out sensitivity on request
- Methods paragraph, R script and software to cite
R packages: R · meta · metafor · ggplot2
Questions
How many studies do I need for Egger's test?
About 10 or more. With fewer, the test has little power to detect asymmetry; the funnel plot is still drawn and the limitation is stated.
Is Egger's test right for odds ratios or risk ratios?
Not the classic version. For binary outcomes PlotScope routes the asymmetry test to one that is valid for events data.