Forest plot generator, run in real R
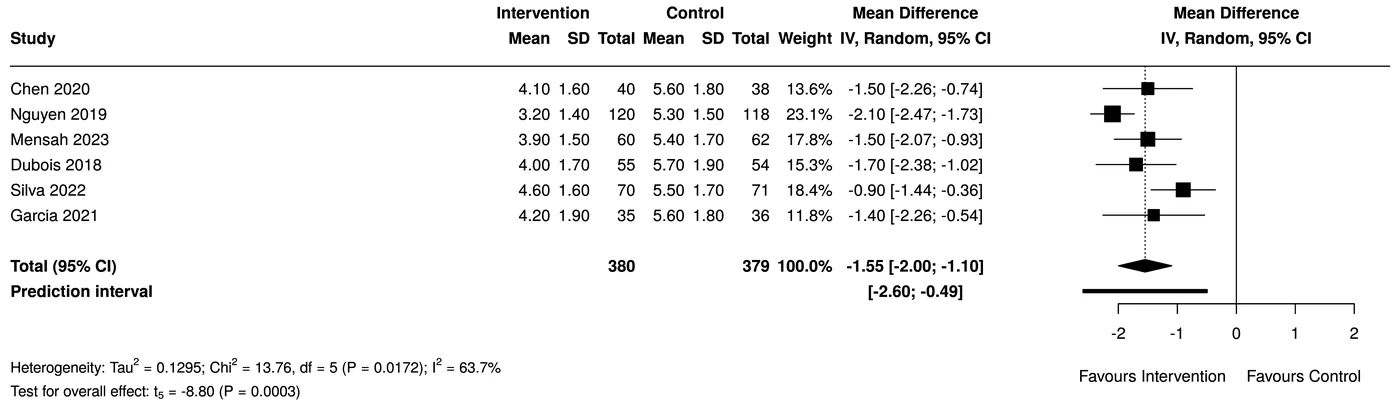
Paste one row per study and get a publication-ready forest plot from the R package meta: random effects with REML and the Hartung-Knapp adjustment, I², τ² and the prediction interval, plus the methods paragraph and the R code.
Your table
| study | mean_int | sd_int | n_int | mean_ctrl | sd_ctrl | n_ctrl |
|---|---|---|---|---|---|---|
| Chen 2020 | 4.1 | 1.6 | 40 | 5.6 | 1.8 | 38 |
| Nguyen 2019 | 3.2 | 1.4 | 120 | 5.3 | 1.5 | 118 |
| Mensah 2023 | 3.9 | 1.5 | 60 | 5.4 | 1.7 | 62 |
One row per study: means, SDs and n per arm (MD or SMD), events and totals per arm (RR or OR), events and totals in one arm (proportions), or a precalculated effect with its SE.
How it is chosen
Random-effects model with REML for τ² and the Hartung-Knapp adjustment for the confidence interval; heterogeneity as I² and τ²; the prediction interval is always shown. The model is fixed before anyone looks at heterogeneity.
You get
- Forest plot in PNG, TIFF, SVG and PPTX
- Pooled effect with 95% CI, I², τ² and prediction interval
- Methods paragraph and figure legend
- R script that reproduces the figure
- Software to cite: R and package versions with references
R packages: R · meta · metafor · ggplot2
Questions
Which model does the forest plot use?
Random effects, with REML for the between-study variance and the Hartung-Knapp adjustment for the confidence interval. The choice is made before looking at heterogeneity, so a low I² never switches it to a common-effect model.
My papers report medians and IQRs. Can I still use them?
Yes. The converter estimates the mean with Luo 2018 and the SD with Wan 2014, and writes the methods sentence that cites both.
How much does it cost?
Reading your table is free. A figure uses about 40 credits; US$ 1 buys 150 credits, with no subscription.