Kaplan–Meier curves with the log-rank test, run in R
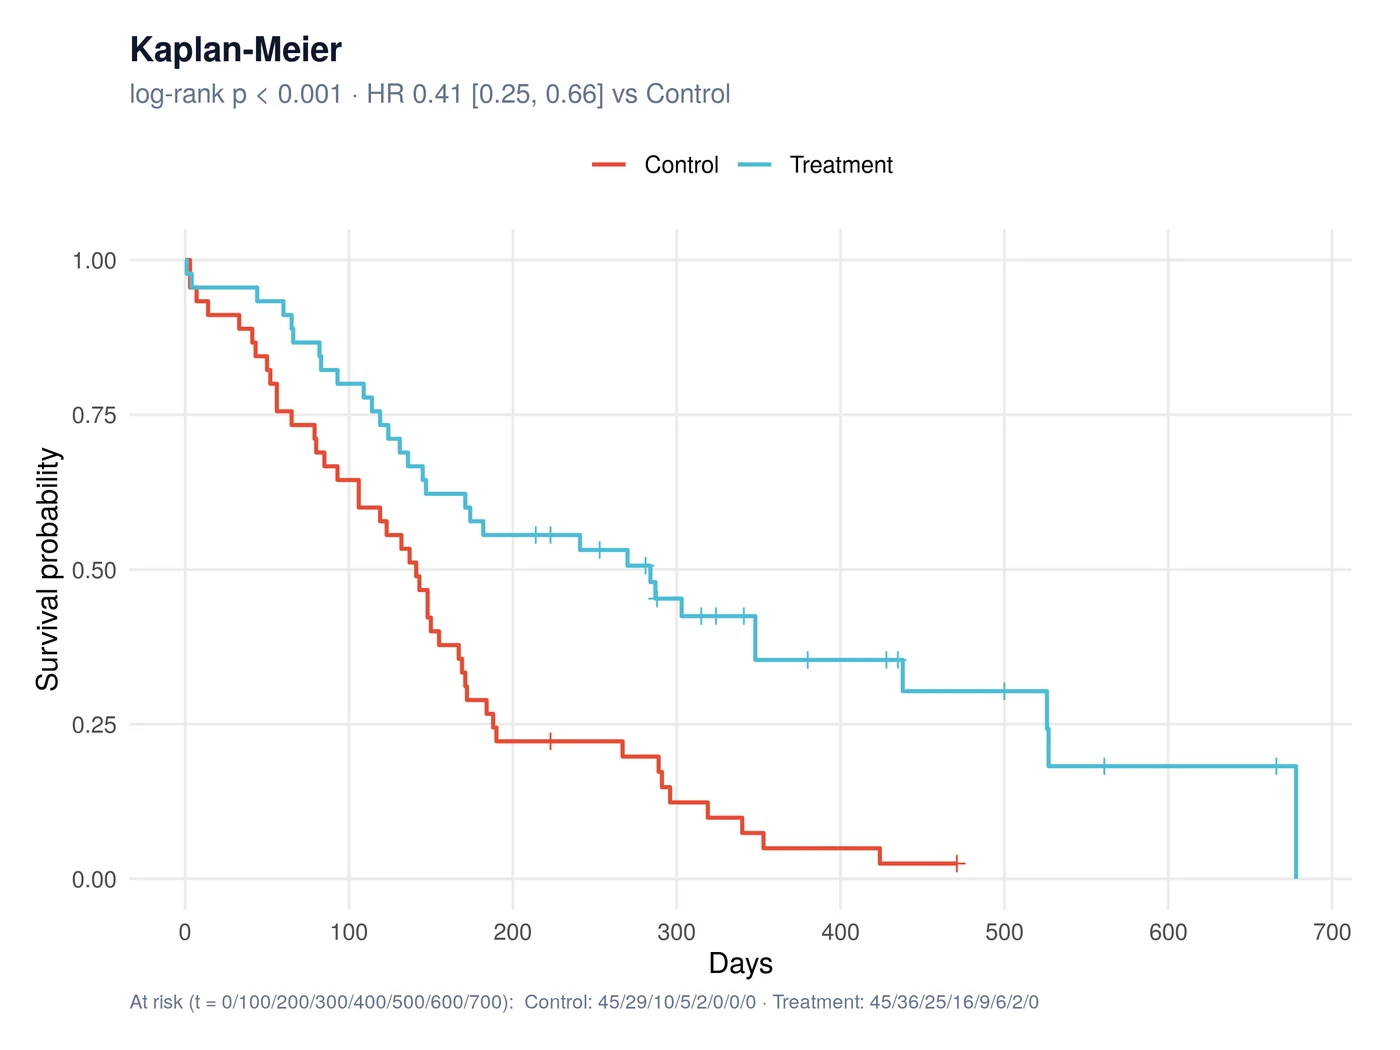
One row per participant with the follow-up time, the event (1 = happened, 0 = censored) and a group. You get Kaplan–Meier curves with the numbers at risk, the log-rank test and the hazard ratio from a Cox model, with proportional hazards checked.
Your table
| time | event | group |
|---|---|---|
| 120 | 1 | Control |
| 365 | 0 | Treatment |
| 48 | 1 | Control |
One row per subject: time, event (1 = happened, 0 = censored) and group or covariates.
How it is chosen
Kaplan-Meier curves with the log-rank test; with a group column, the hazard ratio comes from a Cox model and proportional hazards are checked. An actuarial life table is available for interval data.
You get
- Survival curves with numbers at risk
- Log-rank p and hazard ratio with 95% CI
- Methods paragraph, R script and software to cite
R packages: R · survival · ggplot2
Questions
How do I code censored participants?
Event = 0 for censored, 1 for the event. A 1/2 coding is recognised and converted.
Where does the hazard ratio come from?
From a Cox proportional hazards model fitted to the same data, with the proportional hazards assumption checked.