Statistics in real R
Which statistical test should I use?
Start from the question you are asking. PlotScope reads your columns, picks the test by a fixed rule written before anyone sees a p-value, runs it in real R and explains the result.
Start from your question
Do my groups differ?Welch's t, Mann-Whitney, ANOVA, Welch ANOVA or Kruskal-Wallis, by normality and variancesDid it change in the same people?paired t-test or Wilcoxon signed-rank, by normality of the differencesDoes it change over time, and differently by group?linear mixed model; GEE for yes/no or count outcomesMy outcome is yes/no, or a count.logistic, Poisson or negative binomial regression; chi-squared or Fisher for a 2 × 2 tableHow long until the event?Kaplan-Meier with log-rank, Cox model (HR)Are these variables related?Spearman matrix, Pearson for a pair, linear regression, ANCOVAHow many participants do I need?sample size by design, with the formula and its referenceCombine published studies.random-effects meta-analysis (REML, Hartung-Knapp), funnel, leave-one-out, network
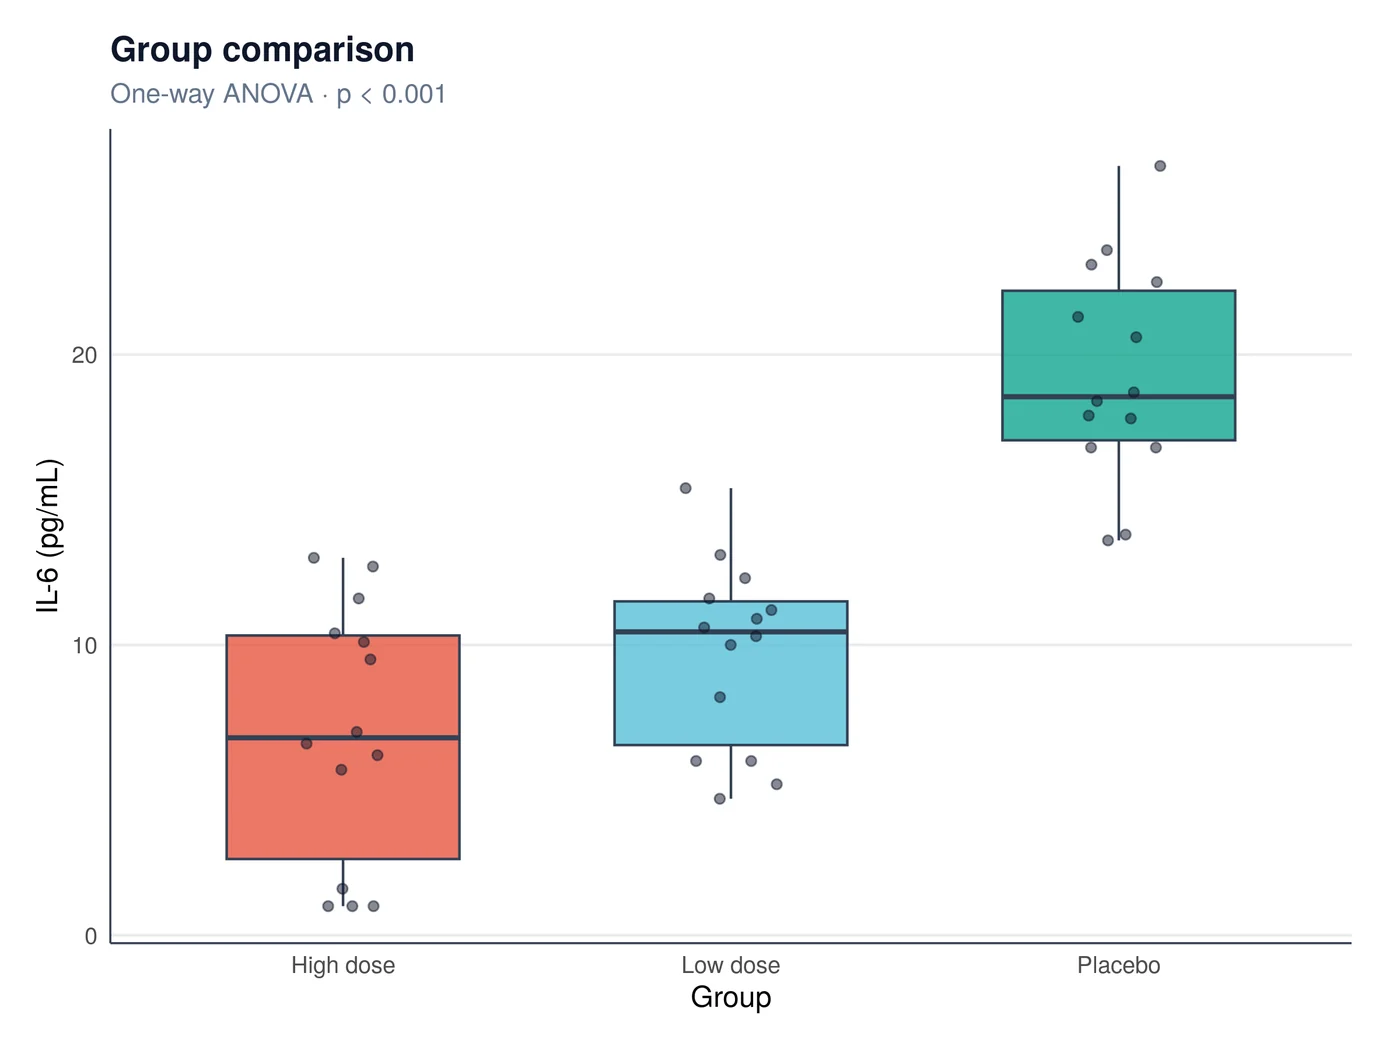
You get
- The figure with the test
- Why this test (the rule, in plain words)
- APA table, methods paragraph, R script and software to cite
R packages: R · stats · meta · survival · lme4 · ggplot2
Questions
Does an AI choose my test?
No. A fixed rule on the server chooses it from your columns; the AI only explains the result in plain words.
Is it real R?
Yes. Every test and figure runs in R, and you get the script to run it again.